Get started with Partner Hub
 Feedback?
After you place an order on CCW, you receive access to Partner Hub where you can set up your own organization.
- Sign in to Partner Hub and select Launch my organization at the top of the left-hand navigation.
- Just like new customers, if this sign in is your first time opening your own organization, a first-time setup wizard with a plan review appears. Accept the terms and conditions, then click Get Started and follow the prompts.
- After your organization is set up, you can add users, manage services, view analytics for your own organization, and so on.
If you need assistance with managing customer trials, we recommend that you assign one of the partner administrator roles to other users in your organization. Go to Users, click a user, then click Roles and Security > Administrator Roles to view all the partner admin roles available.
Customer list
Once you sign in to Partner Hub, you see a list of all the customers that you manage, along with their statuses to know which customers require your attention. Some of the customer statuses available are:
- Trial—Customer has an ongoing Webex trial.
- Subscription—Customer has an active subscription.
- Expiring soon—One of the customer's subscription or trial is going to expire in a couple of days.
- License overage—Customer has a subscription that uses more licenses than what was originally purchased.
- No recent activity—Admins in that customer organization hasn't signed in to Control Hub
- Ready for order setup—A subscription hasn't been fully set up yet.
- Suspended—One of the customer's subscriptions hasn't been paid for yet.
- Expired—Customer has no active subscriptions.
You can also launch directly to a customer’s organization by clicking on the Launch organization icon at the end of the customer’s row.
Custom tags
You can create custom tags for customers in Partner Hub. You can use these tags to identify and group customer according to your processes. Tags are also an easy way to coordinate with other administrators that manage the same customer accounts.
Custom tags are viewable by all administrators in Partner Hub, while editing is limited to partner full administrators and partner administrators.

Filters
Is there a customer that hasn’t had any activity recently? Is there a trial that’s about to expire soon that you have to follow up on? Use query-based filters to easily scan customers that you’re looking for. Possible filters are:
- Managed by—Filter by customers that you manage as an external admin or by customers that are a part of your partner organization.
- Product—Filter customers by the product they've ordered, such as by Webex Meetings, Webex Calling, or Real-Time Translations.
- Status—Filter customers by their subscription, trial, or organization status.
- Subscription Type—Filter customers by if their organization has a subscription or trial.
Search for specific customers by email address
You can use the search bar to quickly find customer organizations by entering the email address of any user within that organization. Type the email address associated with the customer’s organization into the search bar to locate the organization and access its details.
Webex Trials
If you have a customer that wants to give Webex a try, you can start a Webex trial for them in Partner Hub by clicking on the Start Trial button.
Click on a customer to view more of their details, such as information about the subscriptions they’ve purchased and the partner administrators who are assigned to manage that customer.
Subscriptions
In the Subscriptions tab, you can see the date on when the subscription renews, a breakdown of licenses that the customer ordered, the invoice for the subscription, and a table that shows the order history. This tab helps you keep track on if the customer is using up the licenses that they bought, or if they have any license overages and want to purchase more licenses to accommodate their business needs.
Trials
If the customer has any ongoing Webex trials, you can see the details for them in this tab. If they don't have any ongoing trials, you can start one for them.
Partner administrators
This tab shows you a list of partner administrators that are assigned to manage the customer. You can quickly see what role each partner administrator has and add or remove administrators from here as needed.
Administrators that have access to all customers (including partner full administrators and partner read-only administrators) can be managed through the Administrators tab in Partner Hub.
Organization profile
In the Account page, you can find out about the following information for the Partner Hub organization:
- Name of the organization
- Unique ID of the organization
- The type of industry that the organization is used for
- The number of Webex users that the organization plans to have onboarded
Partners can only view analytics data for customers with whom they have an active subscription relationship. If a customer is deleted, their historical data will no longer appear in analytics. For example, if you delete a customer and later want to view a certain chart covering the past 12 months, the chart won’t include any data related to that deleted customer.
Region selector
Customer data is maintained in their organization's region. You must select a specific region to view customer data within those regions.
We plan to make data residency available for Australian customers in the AU region starting February 11, 2026. This means customer data will be stored and managed within the Australian data center, enhancing compliance and security.
Key performance indicators (KPIs)
These KPIs only apply for customers with Webex Calling or Webex Meetings. For example, if a customer only has Webex Messaging, then the KPIs won't capture data for that customer.
The following KPIs are available to help you see a quick high-level view on the status of your customers and their subscriptions:
- Total customers—Number of customers managed by the partner organization.
- Nearing expiration—Number of customers with a subscription or trial that's going to expire within the next 90 days.
- Nearing renewal—Number of customers with subscriptions that are set to auto-renew within the next 90 days.
- Low license assignment—Number of customers that haven't assigned as many licenses compared to other customers in the partner organization.
- Over license limit—Number of customers that assigned more licenses than they've purchased.

Choose to see data for Webex Meetings or Webex Calling
Data in all of the following sections depends on the toggle that you set after the initial KPIs. For example, if you set the toggle to Meetings, then all of the charts and graphs change to only show Webex Meetings data in the subscriptions or trials.
Webex Calling data currently excludes Call on Webex.

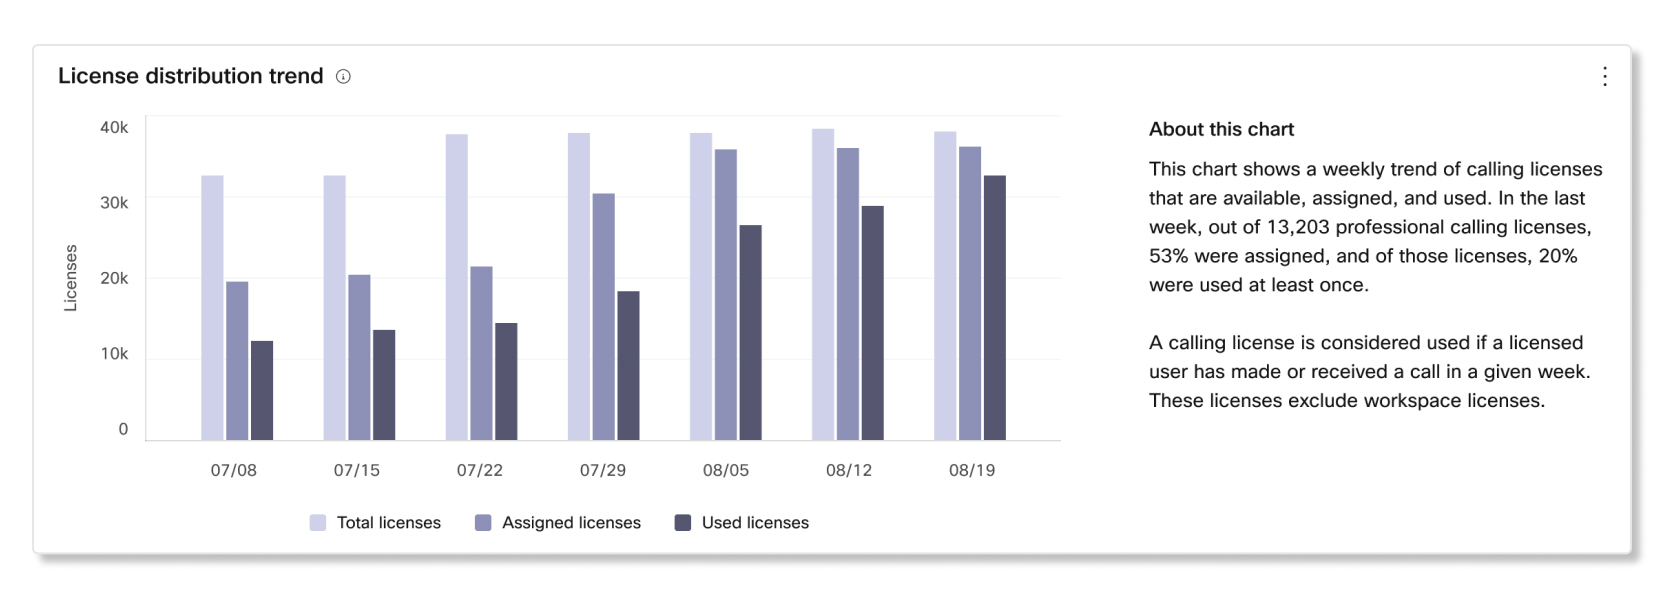
License distribution trend
This chart shows a trend of how customers are using meeting or calling licenses. You can use this chart to get a sense if all your customers are not only assigning the licenses, but if users are also actively joining meetings or making calls.
Recently added customers within the last 90 days
KPIs
- New customers—Number of customers with a new subscription or trial within the last 90 days.
- Total licenses—Total number of licenses between all the subscriptions and trials of recently added customers.

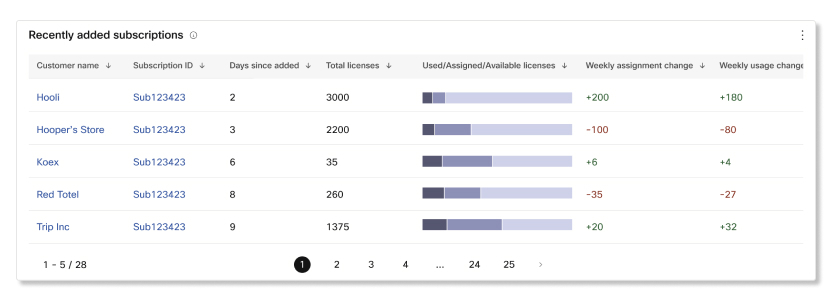
Recently added subscriptions
This table shows which subscription is associated with which customer that was recently added. Details included in this table are:
- Customer—Name of the customer organization.
- Subscription ID—Unique ID of the subscription or Enterprise Trial if it's a trial.
- Days since added—Number of days on when the subscription or trial was added to the customer organization.
- Total licenses—Number of licenses for the subscription or trial.
- Used/Assigned/Available licenses—Distribution of how the customer organization utilized the licenses. You can hover over the bar for more details.
- Weekly assignment change—Difference between the number of licenses assigned compared to last week.
- Weekly usage change—Difference between the number of licenses used compared to last week.
About to expire in next 90 days
KPIs
- Expiring customers—Number of customers with a subscription or trial that's about to expire.
- License assignment—Percentage of licenses assigned between all subscriptions or trials that are about to expire. The percentage calculation is the number of assigned licenses divided by the total number of licenses from all expiring subscriptions and trials.
- License usage—Percentage of licenses that have been used within the last seven days from customers with expiring subscriptions and trials. The percentage calculation is the number of used licenses divided by the total number of licenses from all expiring subscriptions and trials.

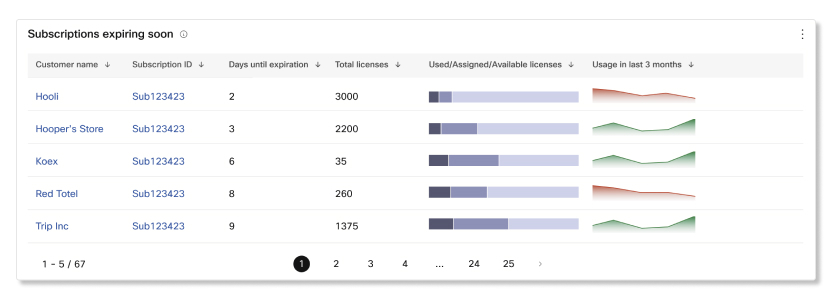
Subscriptions expiring soon
This table shows which expiring subscription is associated with which customer. Details included in this table are:
- Customer—Name of the customer organization.
- Subscription ID—Unique ID of the subscription or Enterprise Trial if it's a trial.
- Days until expiration—Number of days until the subscription or trial is going to expire.
- Total licenses—Number of licenses for the subscription or trial.
- Used/Assigned/Available licenses—Distribution of how the customer organization utilized the licenses. You can hover over the bar for more details.
- Usage in last 3 months—Number of licenses that have been used in the last three months.
About to renew in next 90 days
KPIs
- Renewing customers—Number of customers with subscriptions that are going to auto-renew.
- License assignment—Percentage of licenses assigned between all subscriptions that are set to auto-renew. The percentage calculation is the number of assigned licenses divided by the total number of licenses from all auto-renewing subscriptions.
- License usage—Percentage of licenses that have been used within the last seven days between all subscriptions that are set to auto-renew. The percentage calculation is the number of used licenses divided by the total number of licenses from all auto-renewing subscriptions.

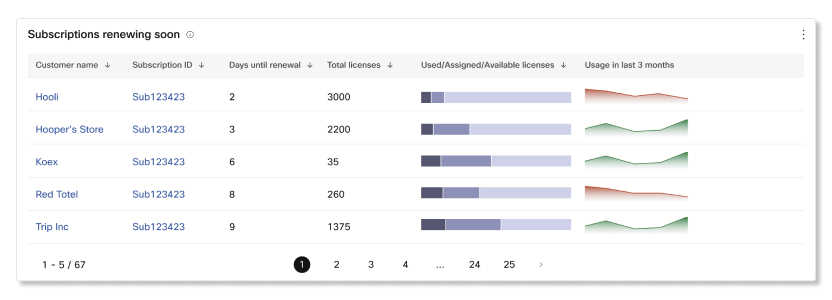
Subscriptions renewing soon
This table shows which expiring subscription that's set to auto-renew is associated with which customer. Details included in this table are:
- Customer—Name of the customer organization.
- Subscription ID—Unique ID of the subscription or Enterprise Trial if it's a trial.
- Days until renewal—Number of days until the subscription or trial is going to atuo-renew.
- Total licenses—Number of licenses for the subscription or trial.
- Used/Assigned/Available licenses—Distribution of how the customer organization utilized the licenses. You can hover over the bar for specific numbers on each license.
- Usage in last 3 months—Number of licenses that have been used in the last three months.
Low assignment of licenses
KPIs
- Low assignment customers—Number of customers that haven't assigned as many licenses compared to similar Webex customers.
- License assignment—Percentage of licenses assigned between all subscriptions and trials with low assignment of licenses. The percentage calculation is the number of assigned licenses divided by the total number of licenses from all subscriptions with low assignment of licenses.
- License usage when assigned—Percentage of licenses that are actually used when assigned, among customers with low assignment of licenses. The percentage calculation is the number of assigned licenses used divided by the total number of licenses from all subscriptions with low assignment of licenses.
- Total unassigned licenses—Number of unassigned licenses from subscriptions and trials of low assignment customers.

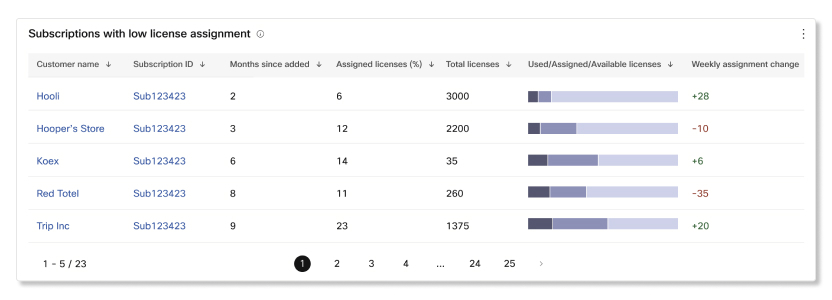
Subscriptions with low license assignment
This table shows which subscription has a low assignment of licenses. Details included in this table are:
- Customer—Name of the customer organization.
- Subscription ID—Unique ID of the subscription or Enterprise Trial if it's a trial.
- Months since added—Number of months on when the subscription or trial was added to the customer organization.
- Assigned licenses (%)—Number and percentage of licenses that have been assigned for the subscription.
- Total licenses—Number of licenses for the subscription or trial.
- Used/Assigned/Available licenses—Distribution of how the customer organization utilized the licenses. You can hover over the bar for specific numbers on each license.
- Weekly assignment change—Difference between the number of licenses assigned compared to last week.
Customers over license limit
KPIs
- Customers with overages—Number of customers with a license overage in a subscription or trial.
- Total licenses in overages—Number of licenses that are in overage between all subscriptions and trials.
- Avg license overage—Average number of customers with a license overage.

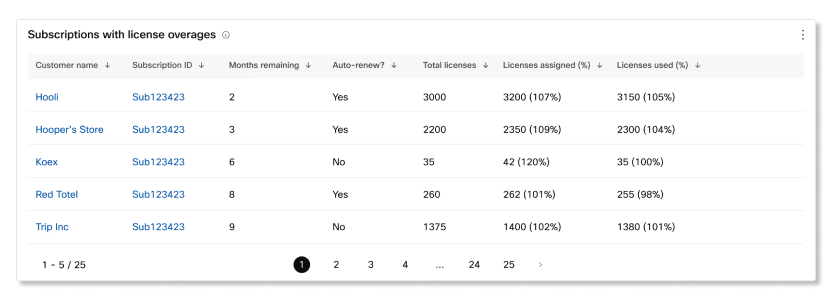
Subscriptions with license overages
This table shows which subscription has a license overage. Details included in this table are:
- Customer—Name of the customer organization.
- Subscription ID—Unique ID of the subscription or Enterprise Trial if it's a trial.
- Months remaining—Number of months until the subscription or trial is going to expire.
- Auto-renew?—If the subscription is set to auto-renew when it’s about to expire.
- Total licenses—Number of licenses for the subscription or trial.
- Licenses assigned (%)—Number and percentage of licenses that have been assigned for the subscription or trial.
- Licenses used(%)—Number and percentage of licenses that have been assigned for the subscription or trial.
These charts apply to customers who have purchased Webex Calling in your organization. Unless otherwise noted, the data shown applies to the most recent completed week. Data refreshes at 00:00:00 UTC every Sunday.
Region selector
Customer data is maintained in their organization's region. You must select a specific region to view customer data within those regions.
Calling usage in last week
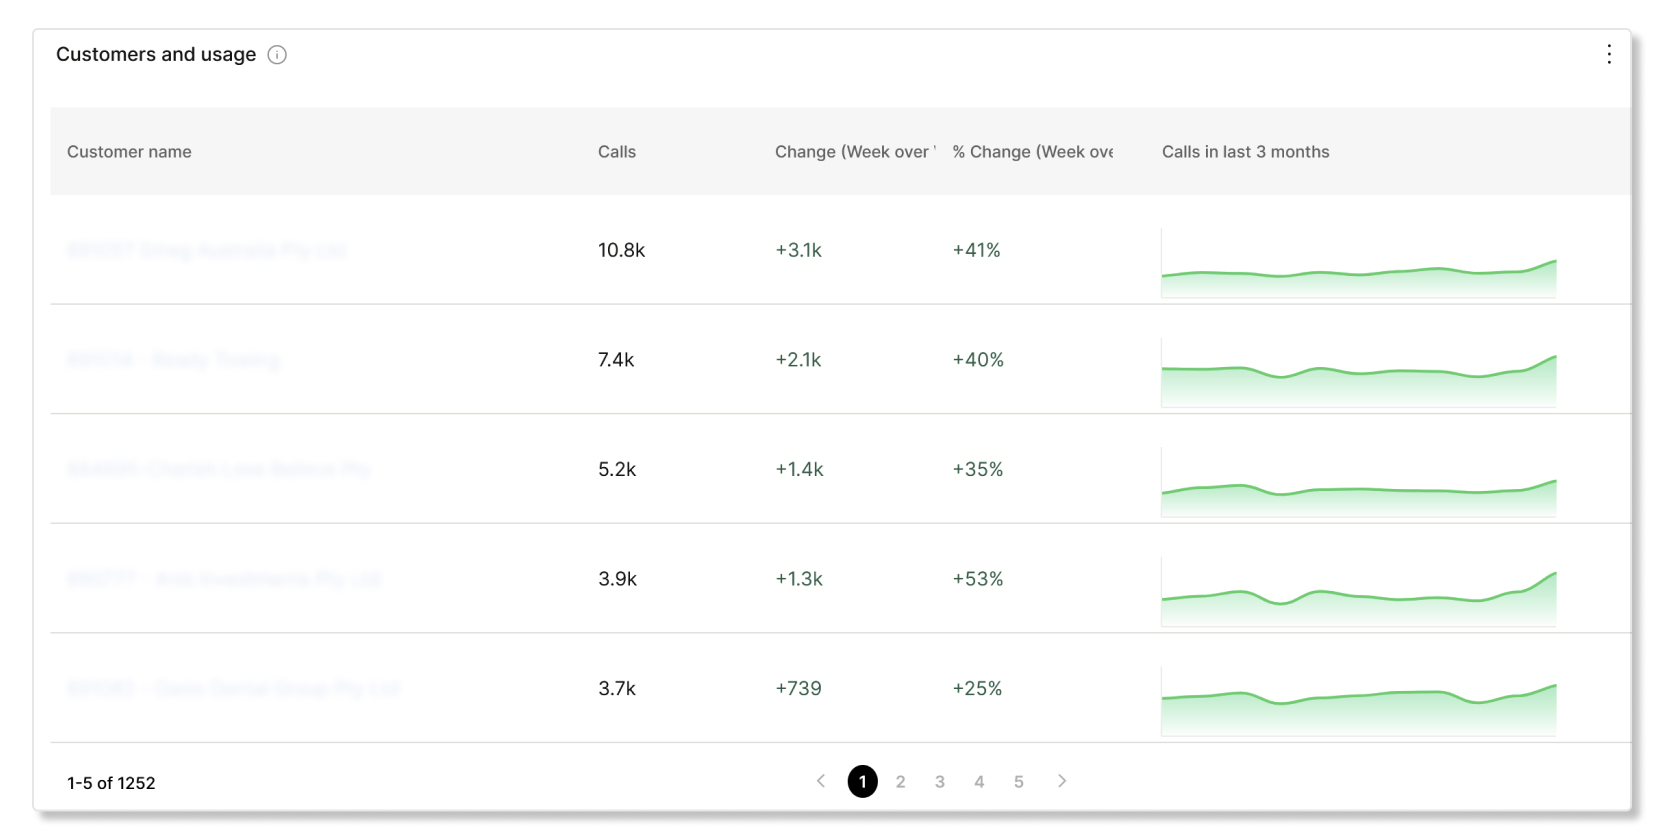
Customers and usage
This table shows you each customer's Webex Calling usage statistics. If you notice that certain statistics are trending downwards, you can reach out proactively and find out why those customers aren't using Webex Calling.
Call quality in last week
Call quality and trend in last 8 weeks
This chart shows you if customers are experiencing any trouble with Webex Calling calls. You can use this chart to help customers troubleshoot when there are spikes of poor quality calls.

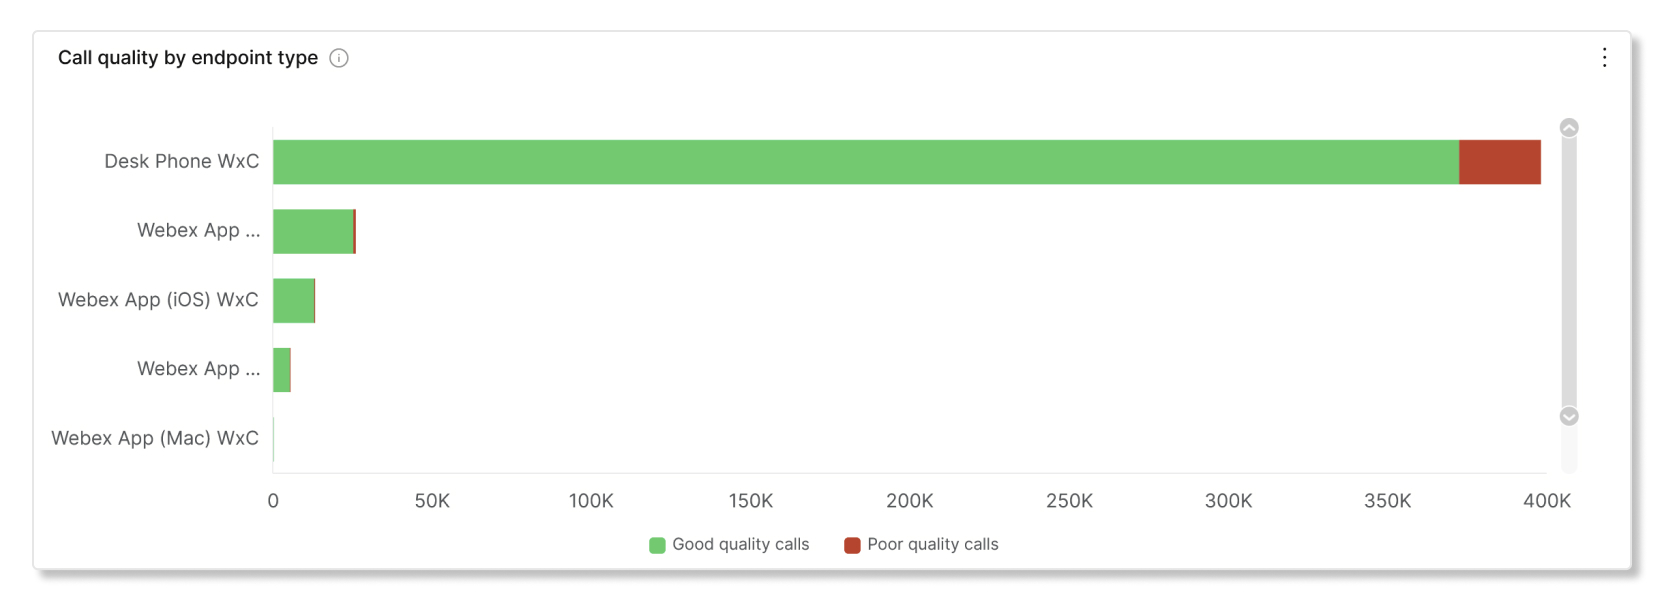
Call quality by endpoint type
This chart shows you a breakdown of the different endpoint types that customers use for Webex Calling calls. You can use this chart to help customers troubleshoot when certain endpoint types are having more poor quality calls than other endpoint types.
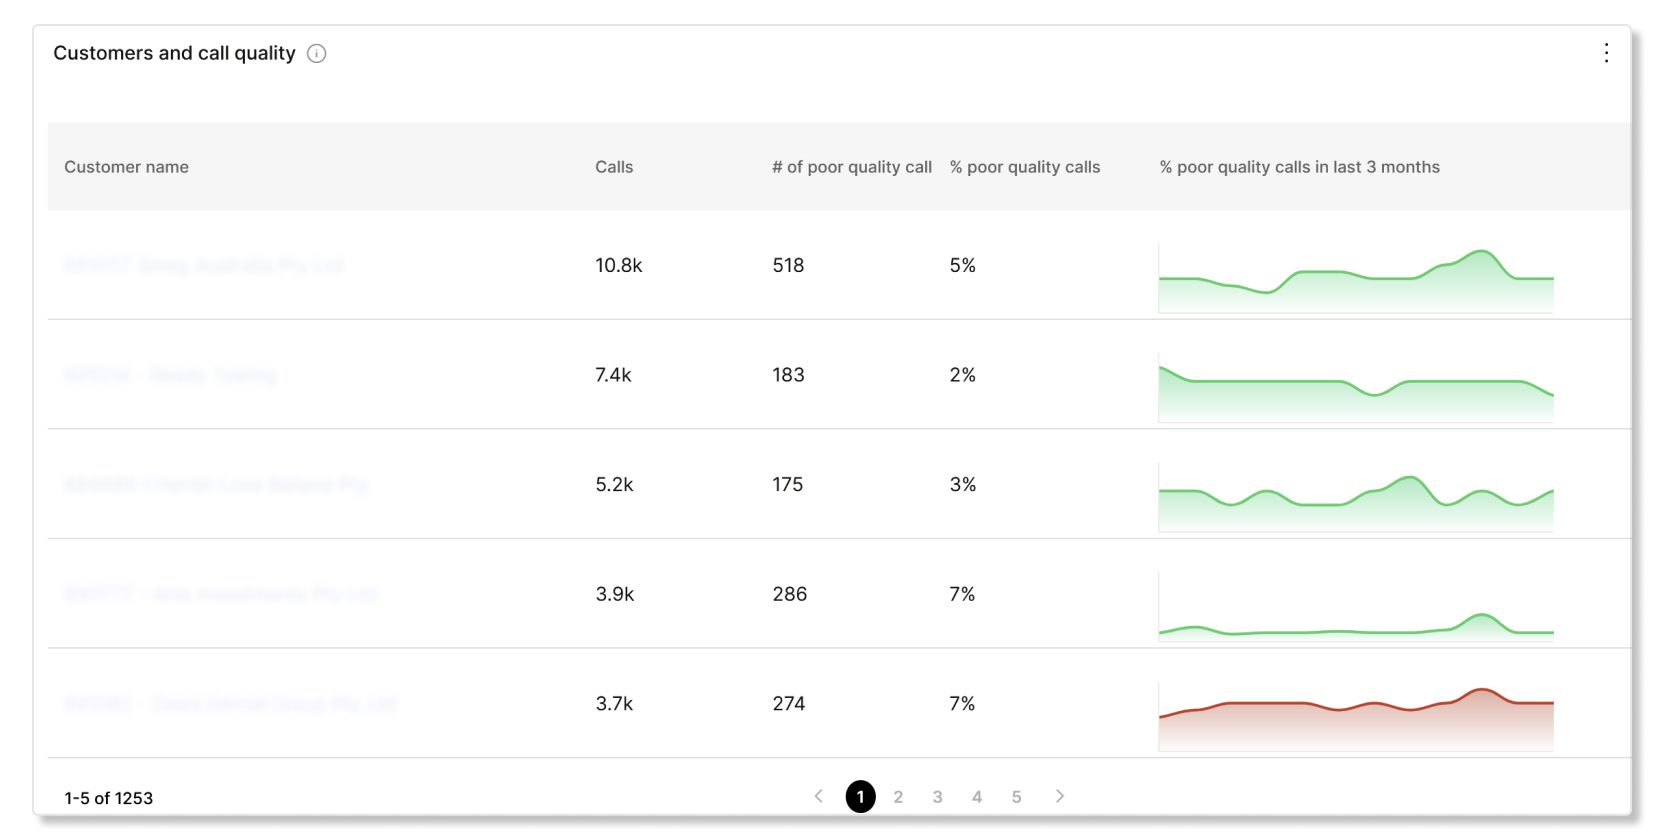
Customers and call quality
This table shows you which customers are having poor quality calls. You can use this table to help customers troubleshoot their poor quality issues before they become widespread.
Advanced call features in last week
This chart only applies to customers who have the Call Queue feature enabled.
Feature use by calls
This chart shows you a breakdown of how many calls used a certain feature. You can use this chart to help customers adopt certain features if the usage count is low.

Call Queue insights in last week
These charts only apply to customers who have the Call Queue feature enabled.
KPIs
- Avg time to answer—Average time that callers had to wait before the call was answered by an agent or the callers were placed in another queue within the last calendar week.
- Avg wait time before abandonment—Average time that callers waited in a queue before hanging up the call or leaving a message within the last calendar week.
- Avg abandoned call rate—Average percentage of calls where callers hung up or left a message before an agent became available when the last calendar week.

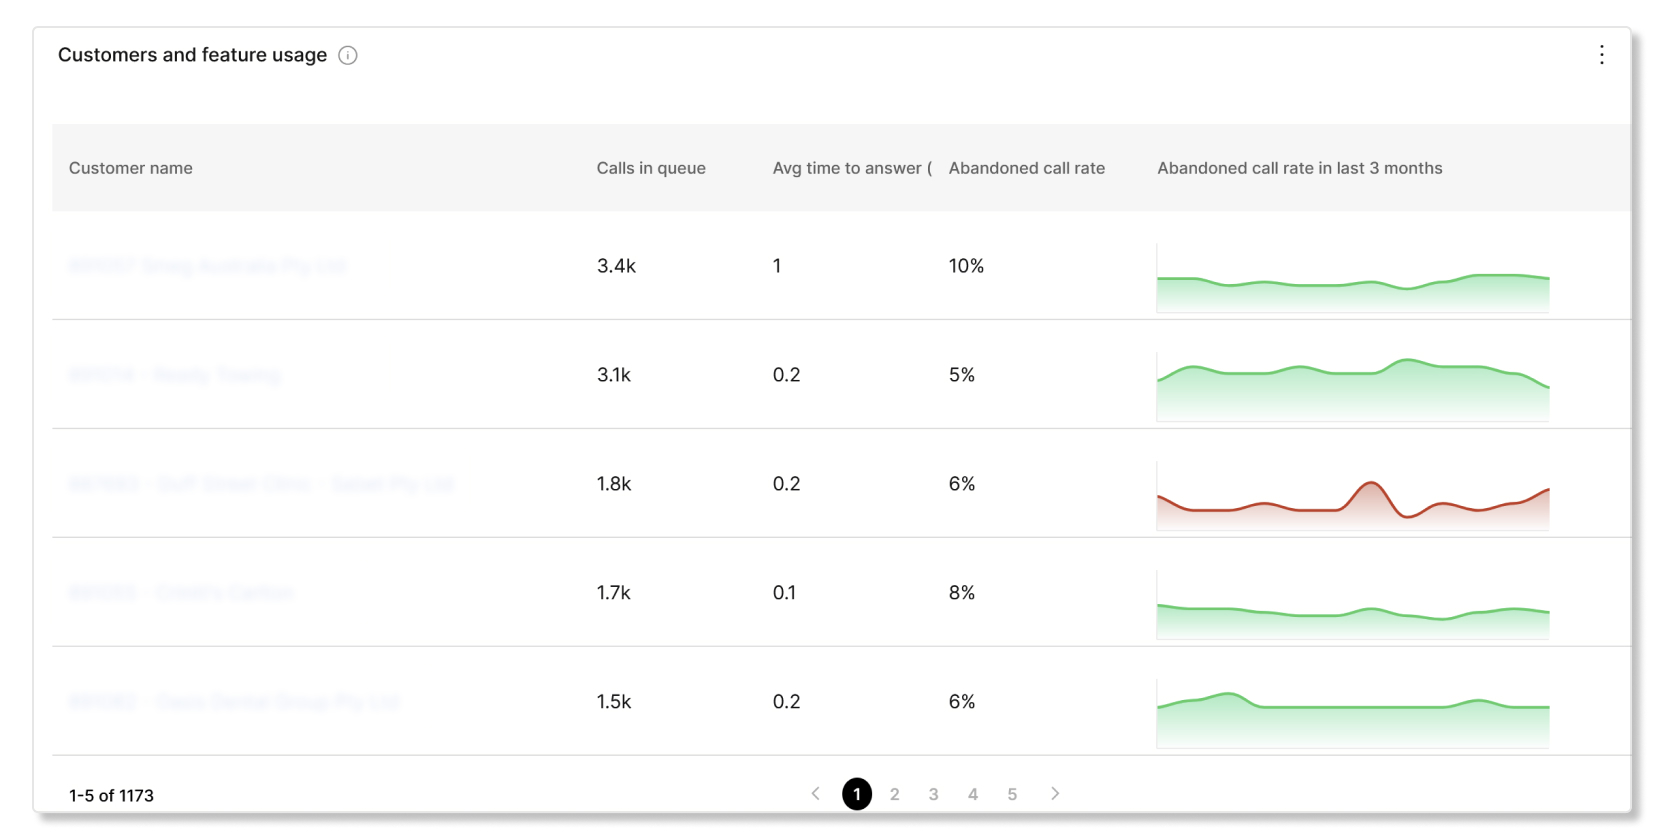
Customers and feature usage
This table shows Call Queue insights for each customer. You can use this table to see if certain customers are having a high percentage of abandoned call rates to help them lower those rates.
For analytics on Wholesale RTM and Webex for Cisco BroadWorks packages, see this article.
You can run reports for your customers to see how they're engaging with Webex in their organization. You can choose to generate a CSV-formatted report immediately or to schedule reports to run automatically in a daily, weekly, or monthly format. When you download a report, the report uses the following naming format for the file:
- Default report template—
Default Template Name_alphanumeric characters_Download Date - Custom report template—
Custom Template Name_alphanumeric characters_Download
            Date
Partners can only view reports data for customers with whom they have an active subscription relationship. If a customer is deleted, their historical data will no longer appear in reports. For example, if you delete a customer and later generate a report covering the past 12 months, the report won't include any information related to that deleted customer.
Region selector
We plan to make data residency available for Australian customers in the AU region starting February 11, 2026. This means customer data will be stored and managed within the Australian data center, enhancing compliance and security.
If you want to view data for customers from a specific region, you can use the region selector. The region selector is only available if the customer's data for the report resides in more than one region. The regions that you can select from are:
- AU—Australia
- CA—Canada
- EU—European Union
- UAE—United Arab Emirates
- US—United States
Calling Usage Details report
This report shows details for the call legs that users in customer organizations made or received with Webex Calling while using Webex App. Data for Calls on Webex isn't included in this report.
Data for new customer organizations can take up to 24 hours to show in the report.
| Column name | Description |
|---|---|
| Customer Name | Name of the customer organization. |
| Org ID | Unique ID of the customer organization in Control Hub. |
| Location | Location of the customer organization. |
| Total calls | Total number of calls made by users. |
| Total call legs | Total number of calls made and received by users. |
| Total poor quality call legs |
Total number of calls made and received by users that were of poor quality. A call leg is categorized as poor if both video and audio stream had jitter above 150ms, latency above 400ms, and packet loss above 5%. This column is calculated using data from Cisco devices only. If a customer uses only non-Cisco (third-party) devices, the column will display a value of 0. |
| Call minutes | Total number of minutes that users were on calls. This column is calculated using data from Cisco devices only. If a customer uses only non-Cisco (third-party) devices, the column will display a value of 0. |
| Call minutes - Video | Total number of minutes that users were on calls with their video turned
on. This column is calculated using data from Cisco devices only. If a customer uses only non-Cisco (third-party) devices, the column will display a value of 0. |
| Call legs - Audio | Number of call legs that used audio. This column is calculated using data from Cisco devices only. If a customer uses only non-Cisco (third-party) devices, the column will display a value of 0. |
| Call legs - Video | Number of call legs that used video. This column is calculated using data from Cisco devices only. If a customer uses only non-Cisco (third-party) devices, the column will display a value of 0. |
| Call legs - Desk Phone | Number of call legs that were made or received on Cisco desk phones. This column is calculated using data from Cisco devices only. If a customer uses only non-Cisco (third-party) devices, the column will display a value of 0. |
| Call legs - Room Device | Number of call legs that were made or received on Cisco Room Series
devices. This column is calculated using data from Cisco devices only. If a customer uses only non-Cisco (third-party) devices, the column will display a value of 0. |
| Call legs - Other Devices | Number of call legs that were made or received on third-party devices. This column is calculated using data from Cisco devices only. If a customer uses only non-Cisco (third-party) devices, the column will display a value of 0. |
| Calls - Hunt Group Calls | Total number of incoming calls that were routed to hunt groups. |
| Calls - Auto Attendant Calls | Total number of incoming calls that were routed to auto-attendants. |
| Call queue - Total calls | Total number of incoming calls that were routed to call queues. |
| Call queue - Timed out calls | Number of calls that overflowed because the wait time exceeded the maximum limit. |
| Call queue - Overflowed calls | Number of calls that overflowed because the queue limit was met. |
| Call queue - Transferred calls | Number of calls that were transferred out of the queue. |
| Call queue - Abandoned calls | Number of calls where the caller hung up or left a message before an agent became available. |
| Total internal calls | Total number of inter or intra-location dialing within the same organization. |
| Total toll free calls | Total number of toll-free based calls. Freephone number for the calling party. |
| Total premium rate calls | Total number of calls that use enhanced or extended Toll Premium Services, premium rate, or special rate number. Sometimes barred. |
| Total integrated audio calls | Total number of Integrated Audio for Webex Calling calls. A call in or callback to a Webex Meeting using a Webex Calling app or device. |
| Total national calls | Total number of outgoing domestic calls within the user's region. |
| Total inbound calls | Total number of inbound or incoming calls. This type covers all inbound calls from PSTN or another external trunk. |
| Total operator service calls | Total number of calls that use network operator services. Example: To start any call that requires an operator's assistance. |
| Total spark calls | Total number of calls made and received by users. |
| Total short number calls | Total number of shortcode feature/service calls. Short numbers are premium or free, depending on region and service. |
| Total international calls | Total number of outgoing calls made to another region from the user's home region. |
| Total mobile calls | Total number of mobile/cell calls made and received by users. Mobile/cell call is when the user originated the call with their mobile number, or received the call when called on their mobile number. |
| Total emergency calls | Total number of emergency calls. For example, dialing 911 in the U.S. |
| Total unknown calls | Total number of calls where the call types couldn't be determined. |
Devices report
This report allows partner hub administrators to download a consolidated view of the entire current inventory of devices for all customers they manage. As this is a point in time inventory report, time ranges cannot be specified.
Changes made to devices may take up to 24 hours to be reflected in the report.
| Column name | Description |
|---|---|
| External ID | External ID provided when creating a Wholesale customer. This field is empty for non-Wholesale customers. |
| Customer | Name of the customer organization. |
| Customer Org ID | Organization UUID of the customer organization. |
| Location ID | UUID of the location in the customer organization that the device belong to. |
| Location Name | Name of the location in the customer organization that the device belongs to. |
| Product | Product type of the device. |
| MAC | Media Access Control address of the device. |
| Firmware | Software version of the device. |
| Phone Number | Primary phone number associated with the device. |
| Extension | Primary extension associated with the device. |
| User ID | This field contains the ID of the user that the device is assigned to. |
| User UUID | UUID of the user that the device is currently assigned to. |
Telephone Numbers report
This report allows you to download a consolidated view of the entire current inventory of Webex Calling telephone numbers and extensions for all customers they manage. As this is a point in time inventory report, time ranges can't be specified.
Changes made to phone numbers or extensions may take up to 24 hours to be reflected in the report.
| Column name | Description |
|---|---|
| External ID | External ID provided when creating a Wholesale customer. This field is empty for non-Wholesale customers. |
| Customer | Name of the customer organization. |
| Customer Org ID | Organization UUID of the customer organization. |
| Location ID | UUID of the location in the customer organization that the phone number belong to. |
| Location Name | Name of the location in the customer organization that the phone number belongs to. |
| Country | Country of the location in the customer organization that the phone number belongs to. |
| Phone Number | Phone Number (this field is empty for extensions). |
| Extension | Extension (this field is empty for phone numbers). |
| PSTN Connection | Provider who offers the PSTN connection for the phone number (this field is empty for Extensions). |
| Active | Status of the phone number. Possible values are:
|
| User Type | Type of user that the phone number is assigned to. For example, "People," "Auto Attendant," "Virtual Line," etc. This field is empty for unassigned phone numbers. |
| Number Type | This field is “Primary” or “Secondary” depending on whether the phone number is the primary or secondary number for the user. This field is empty for extensions or unassigned phone numbers. |
| User ID | This field contains the ID of the user that the phone number or extension is assigned to. For phone numbers with the user type of “People,” this field contains the email address of the user. This field is empty for unassigned phone numbers, or numbers assigned to certain features. |
| User UUID | This field contains the UUID of the user that the phone number or extension is assigned to. For phone numbers with the user type of “People,” this field contains the UUID of the user. For phone numbers with the user type of “Auto Attendant,” this field contains the UUID of the auto attendant, and so on. This field is empty for unassigned phone numbers. |
Webex App Version report
This report presents aggregated counts of Webex App versions used across different platforms and operating systems by users in customer organizations managed by the partner over the past 90 days.
If you need to identify individual users who are on specific versions of Webex App or platforms, you can launch into the customer's Control Hub and download the customer's Webex App Version report.
| Column name | Description |
|---|---|
| Customer name | Name of the customer organization. |
| Organization ID | Unique identifier of the customer organization. |
| App Type | Type of Webex App client installed on the user's operating system. |
| Platform | Details about the machine. |
| Version | Latest detected version of the Webex App client. |
| OS Version | Latest detected operating system version of the machine. |
| Number Of Users | Number of users on the specific platform and version. |
Subscription Details report
This report shows you your customer's provisioned and allocated product licenses.
| Column name | Description |
|---|---|
| Calculation Date | Date that the report was run for. |
| Customer Name | Name of the customer organization. |
| Organization Id | Unique identifier of the customer organization. |
| (Wholesale) External Id | External identifier of the wholesale customer organization. |
| Subscription Status |
Indicates whether the subscription is a trial. Possible values are:
|
| Subscription Id | Unique identifier of the subscription. |
| Subscription Type | Type of subscription that the customer bought. |
| Auto-Renew Enabled | If the subscription has auto-renew enabled or not. |
| Expiration / renewal Date | Date of when the subscription auto-renews or expires. |
| Total Users in Organization | Number of users in the customer’s organization. |
| Total Verified Users | Number of users who have the verified status in Control Hub. |
| Total Workspace Usage in Organization | Number of workspace licenses that the customer has purchased. |
| Total Meeting Participants - last 30 days | Number of users who joined meetings within the last 30 days of the calculation date. |
| Total Call Minutes - last 30 days | Number of Webex Calling minutes within the last 30 days of the calculation date. |
| Total Messages Sent - last 30 days | Number of messages sent in Webex App within the last 30 days of the calculation date. |
| Meetings license - available | Number of Webex Meetings licenses available in the customer’s organization. |
| Meetings license - assigned | Number of Webex Meetings licenses assigned to users. |
| Meetings license - used | Number of Webex Meetings licenses that were used at least once (such as joining or hosting a meeting) by users. |
| Calling Professional license - available | Number of Webex Calling Professional licenses available in the customer’s organization. |
| Calling Professional license - assigned | Number of Webex Calling Professional licenses assigned to users. |
| Calling Professional license - used | Number of Webex Calling Professional licenses that were used at least once (such as joining or starting a call) by users. |
| Calling Standard license - available | Number of Webex Calling Standard licenses available in the customer’s organization. |
| Calling Standard license - assigned | Number of Webex Calling Standard licenses assigned to users. |
| Calling Standard license - used | Number of Webex Calling Standard licenses that were used at least once (such as joining or starting a call) by users. |
| Customer Assist License - available | Number of Customer Assist licenses available in the customer’s organization. |
| Customer Assist License - assigned | Number of Customer Assist licenses assigned to users in the customer’s organization. |
| (Wholesale) Common Area Calling - available | Number of Common Area Calling licenses available in the wholesale customer’s organization. |
| (Wholesale) Common Area Calling - assigned | Number of Common Area Calling licenses assigned to users in the wholesale customer's organization. |
| (Wholesale) Webex Calling - available | Number of Webex Calling licenses available in the wholesale customer’s organization. |
| (Wholesale) Webex Calling - assigned | Number of Webex Calling licenses assigned to users in the wholesale customer’s organization. |
| (Wholesale) Webex Calling Standard - available | Number of Webex Calling Standard licenses available in the wholesale customer’s organization. |
| (Wholesale) Webex Calling Standard - assigned | Number of Webex Calling Standard licenses assigned to users in the wholesale customer’s organization. |
| (Wholesale) Webex Voice - available | Number of Webex Voice licenses available in the wholesale customer’s organization. |
| (Wholesale) Webex Voice - assigned | Number of Webex Voice licenses assigned to users in the wholesale customer’s organization. |
| (Wholesale) Customer Assist - available | Number of Customer Assist licenses available in the wholesale customer’s organization. |
| (Wholesale) Customer Assist - assigned | Number of Customer Assist licenses assigned to users in the wholesale customer’s organization. |
| (Wholesale) Webex Suite - available | Number of Webex Suite licenses available in the wholesale customer’s organization. |
| (Wholesale) Webex Suite - assigned | Number of Webex Suite licenses assigned to users in the wholesale customer’s organization. |
| (Wholesale) Attendant Console - available | Number of Attendant Console licenses available in the wholesale customer’s organization. |
| (Wholesale) Attendant Console - assigned | Number of Attendant Console licenses assigned to users in the wholesale customer’s organization. |
| (Wholesale) Webex Meetings - available | Number of Webex Meetings licenses available in the wholesale customer’s organization. |
| (Wholesale) Webex Meetings - assigned | Number of Webex Meetings licenses assigned to users in the wholesale customer’s organization. |
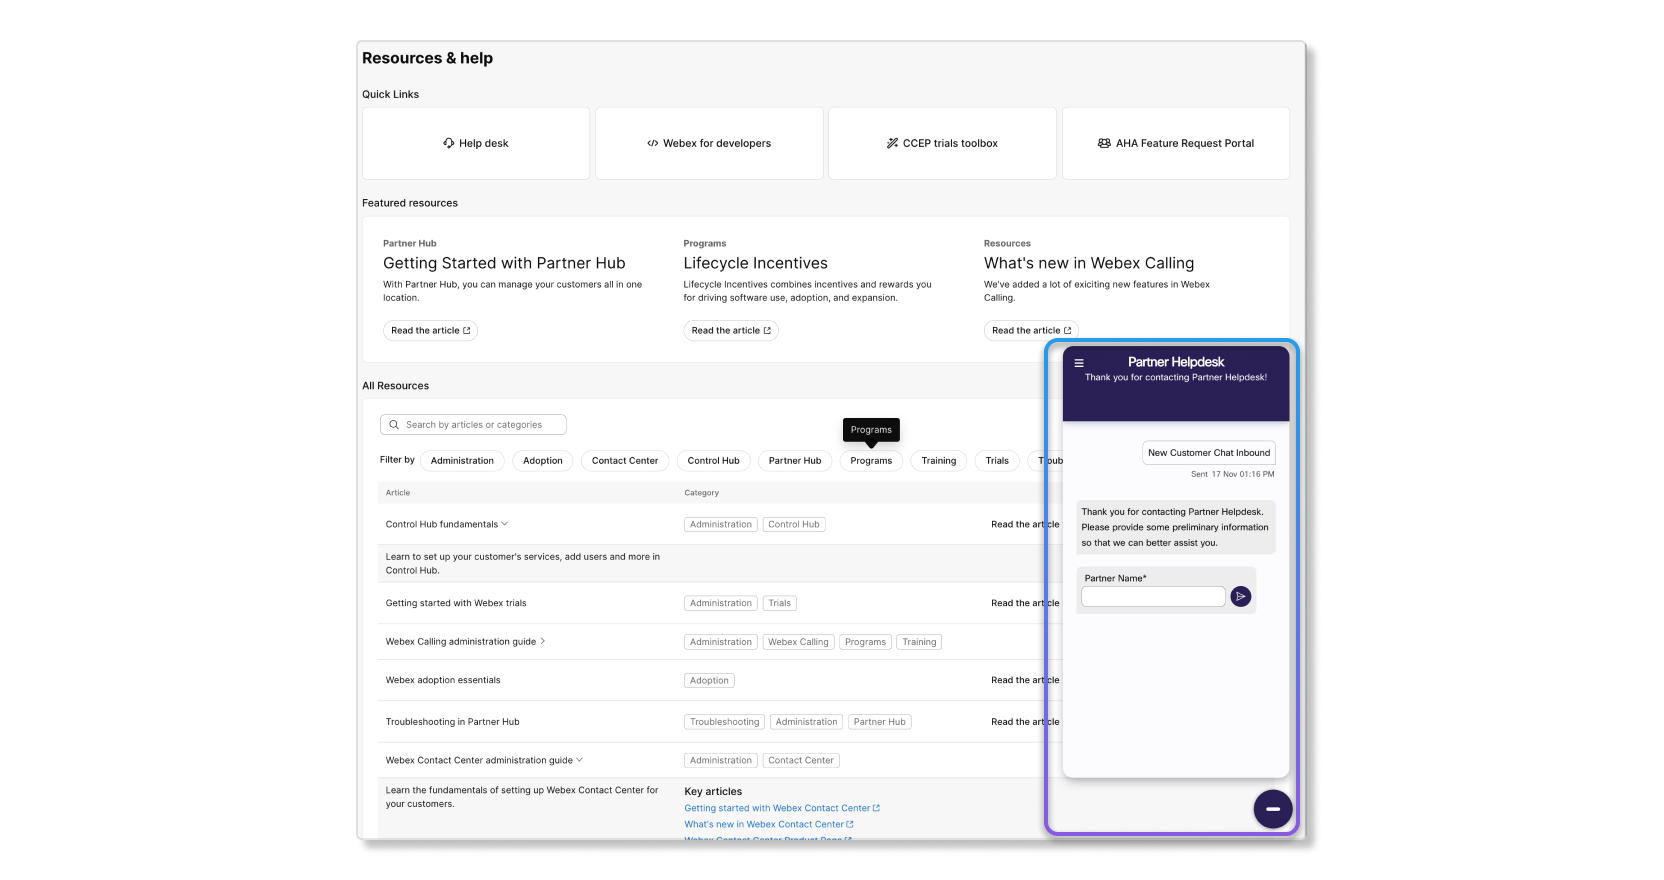
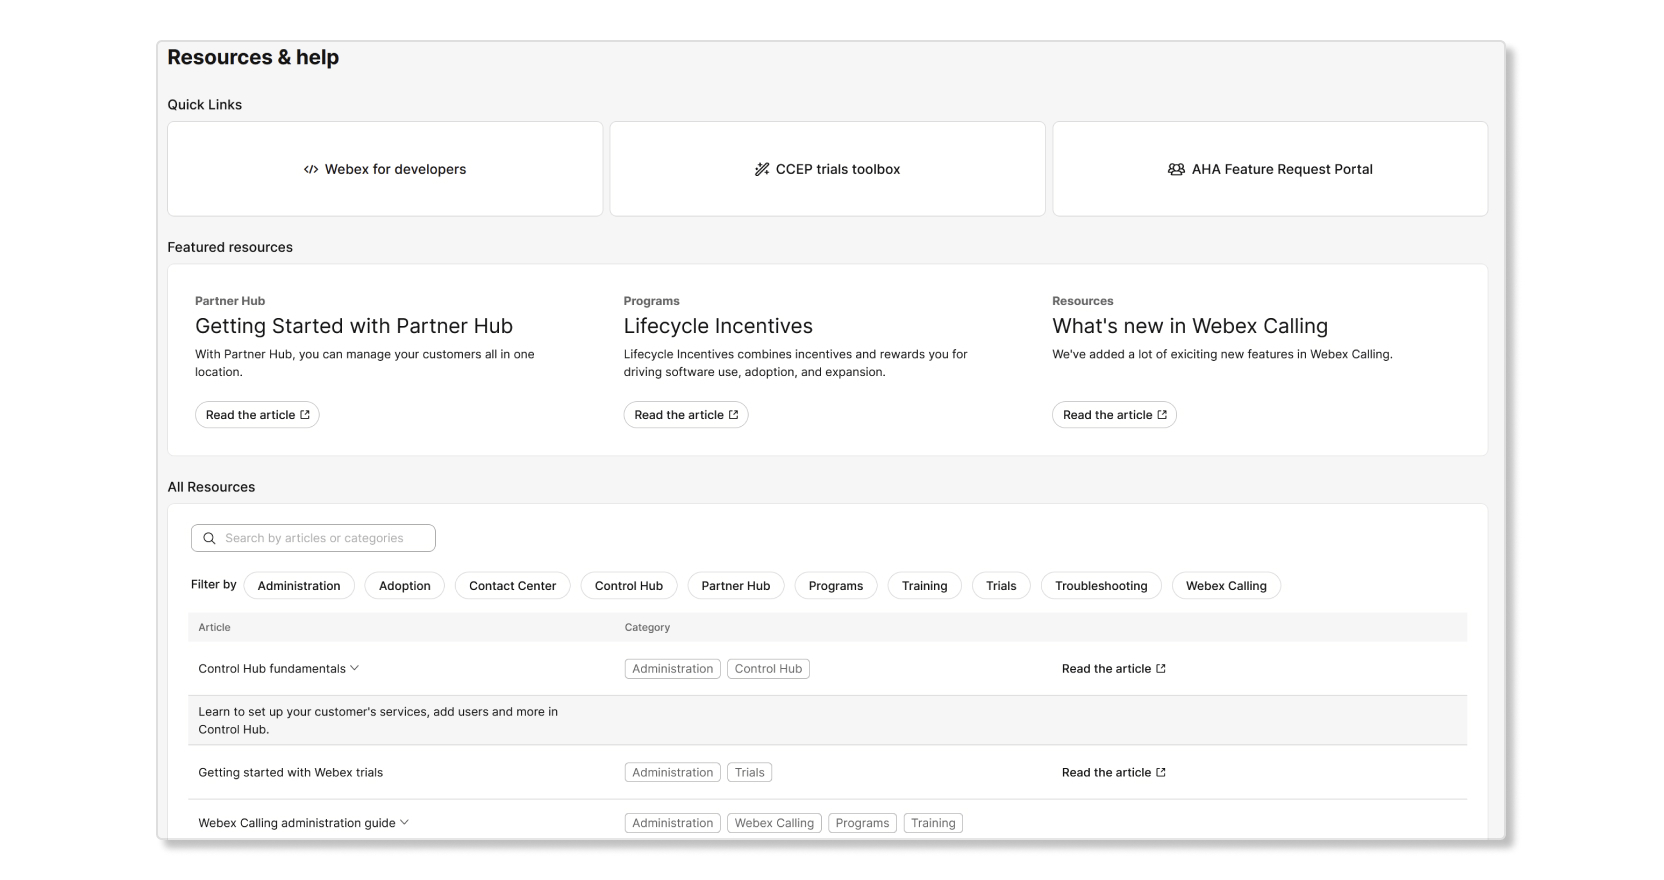
If you need help with anything partner related, you can use the Resources & help section to find the information you're looking for. This section has the following areas of note:
- Quick links—Links that are popular with partners.
- Featured resources—Links to features that we want to showcase.
- All resources—A comprehensive search tool that you can use to find specific resources you're looking for. You can also use filters to narrow down what you want to find.
Partner Helpdesk
You can now reach Partner Helpdesk through Partner Hub. Click on the icon below to reach our Partner Helpdesk team for assistance with Webex Calling and Contact Center.
